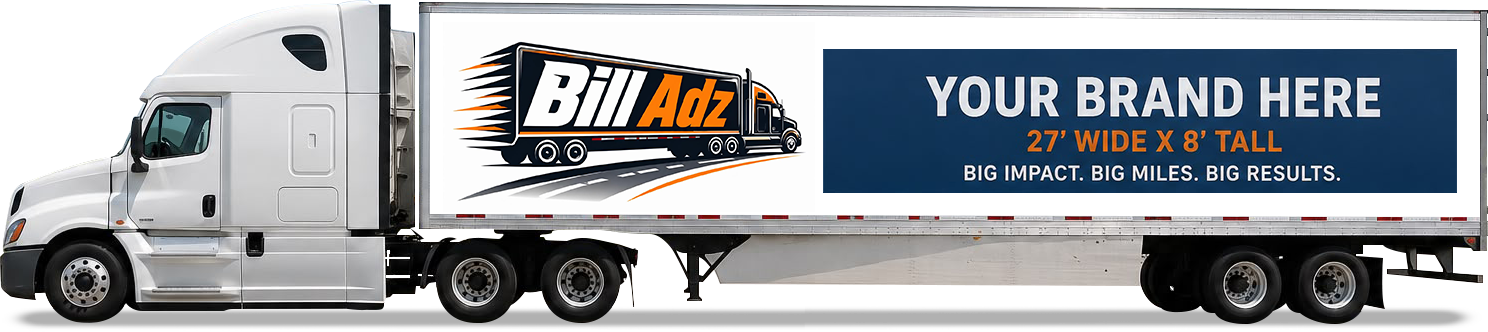
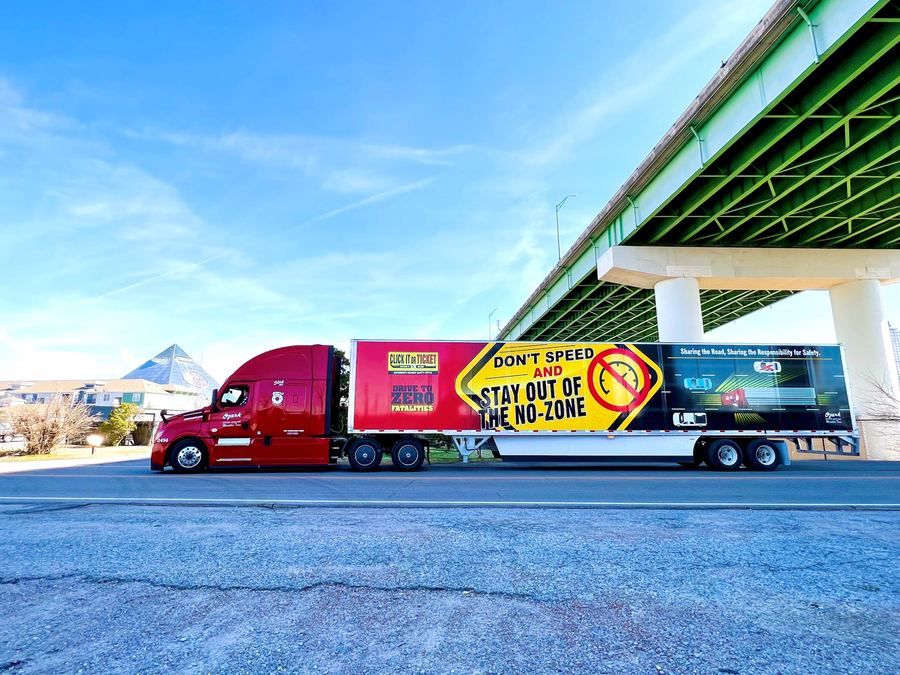
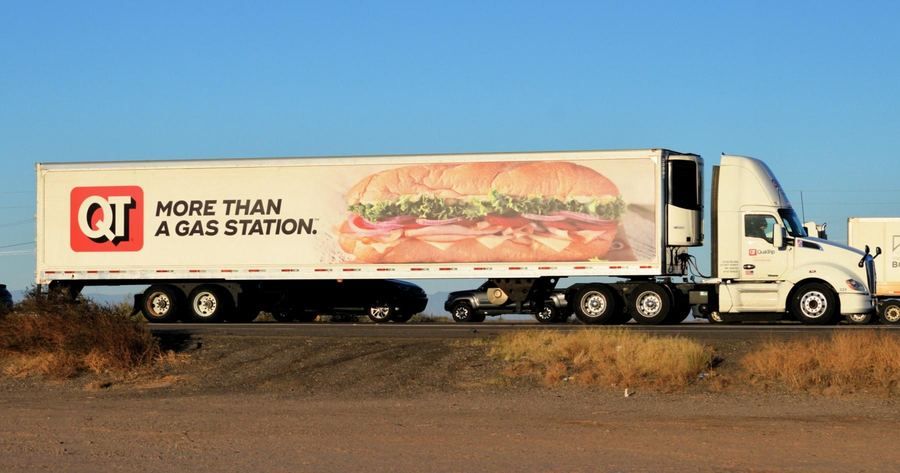
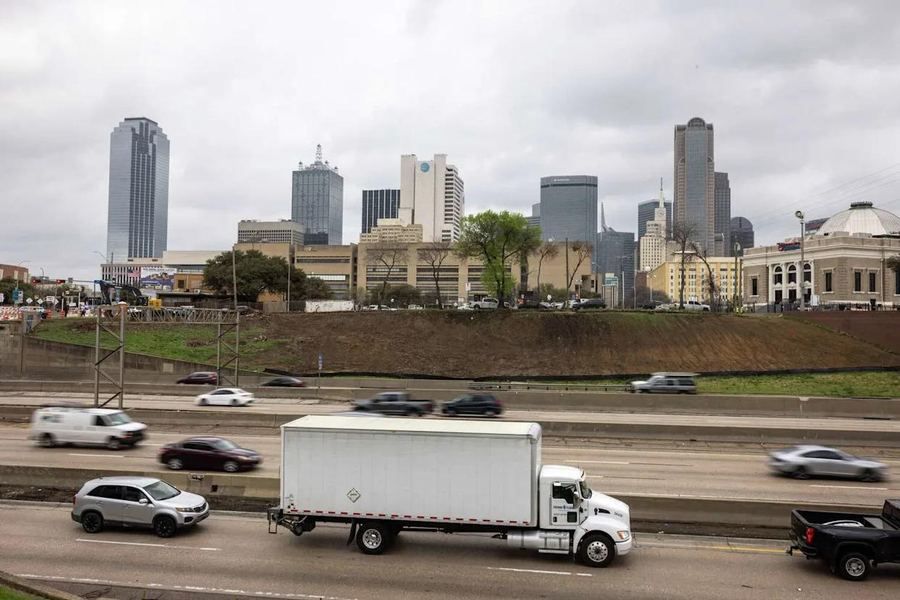
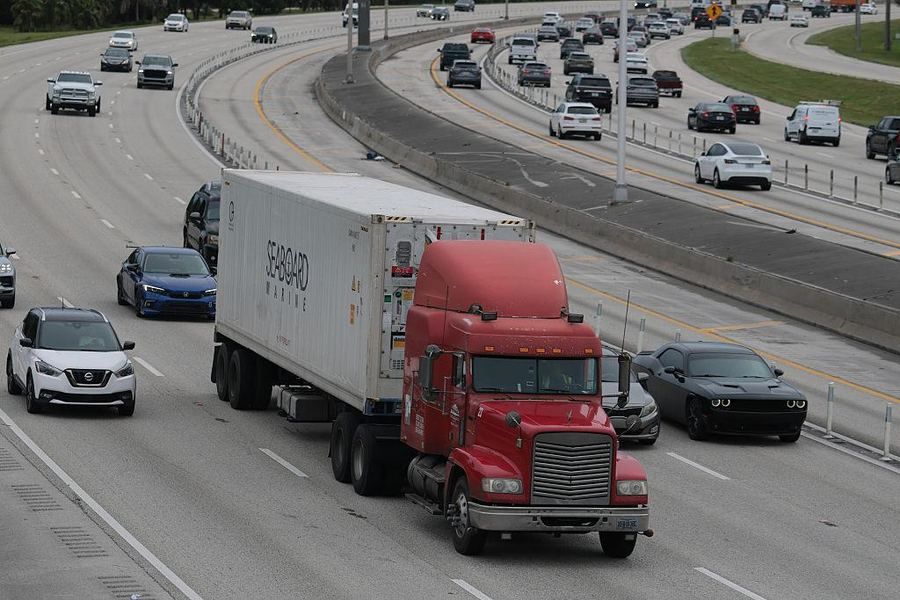
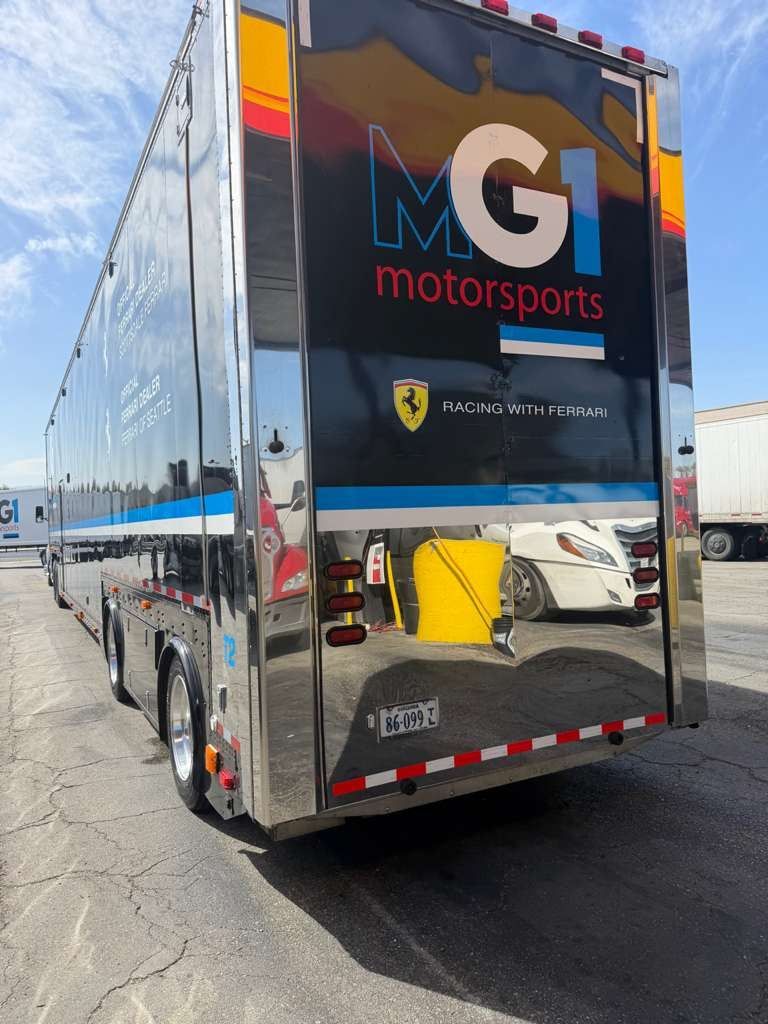
A common question from fleet owners and advertisers: if a 53' trailer carrying a 27'×8' side billboard drives from Los Angeles to New York City, how many gross impressions does that trip actually generate? Here's the math.
The same traffic-count approach used across the Out-of-Home industry (similar to Geopath circulation methodology), applied to a moving trailer instead of a fixed billboard.
Break the trip into highway legs: LA → Phoenix → Albuquerque → Amarillo → OKC → Memphis → Nashville → Knoxville → Harrisburg → NYC.
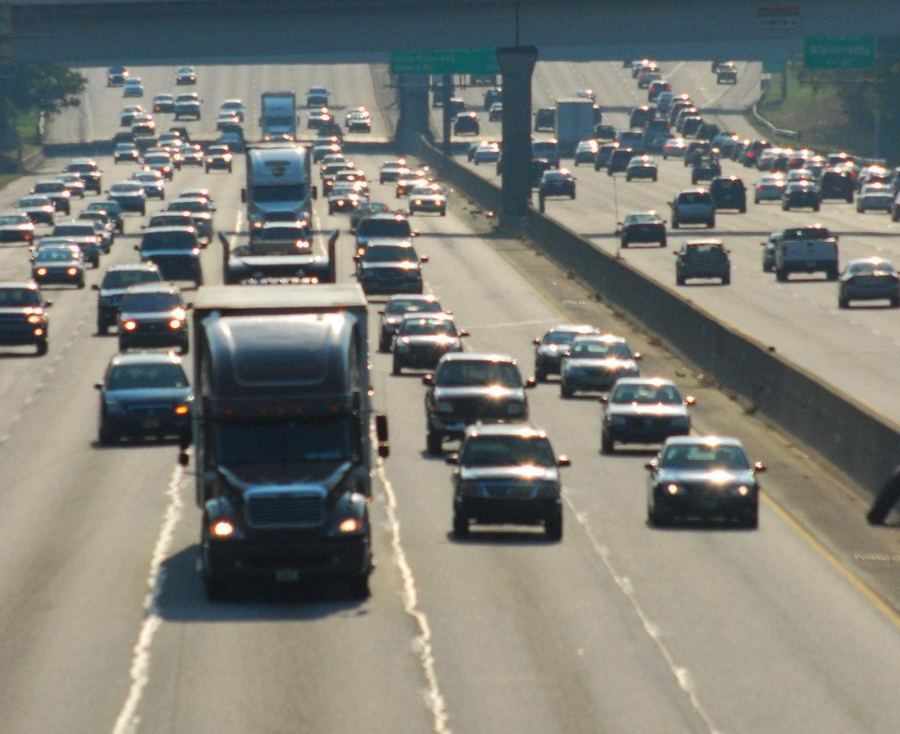
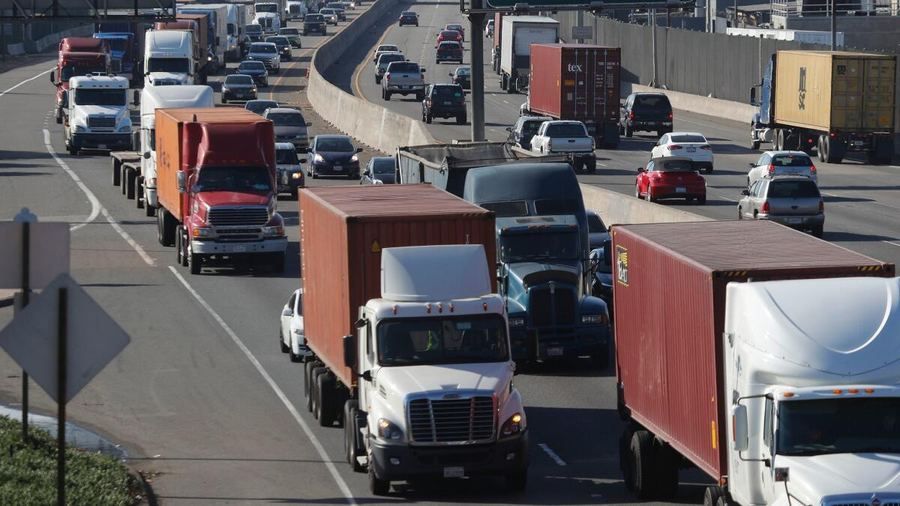
Apply typical Average Annual Daily Traffic (AADT) counts for each highway segment — these range from ~20,000 on rural stretches to 100,000+ near major metros.
Longer legs driven at a ~500 mi/day pace carry more weight, since the trailer spends more exposure time on that traffic volume.
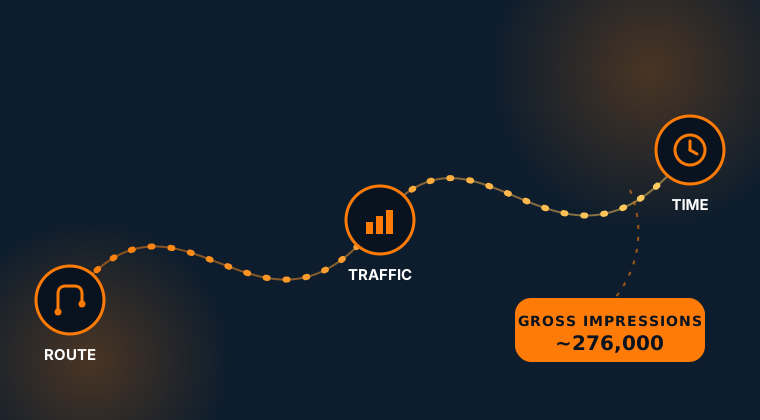
Add every leg's contribution together to get total gross impressions for the one-way trip.
Southern corridor: I-10 → I-40 → I-81 → I-78, the most common legal routing for 53' trailers coast to coast.
| Leg | Highway | Approx. Miles | Typical AADT | Est. Impressions |
|---|---|---|---|---|
| Los Angeles, CA → Phoenix, AZ | I-10 | ~370 | 70,000–110,000 | ~65,000 |
| Phoenix, AZ → Albuquerque, NM | I-40 | ~330 | 35,000–45,000 | ~26,000 |
| Albuquerque, NM → Amarillo, TX | I-40 | ~285 | 20,000–28,000 | ~14,000 |
| Amarillo, TX → Oklahoma City, OK | I-40 | ~260 | 25,000–35,000 | ~16,000 |
| Oklahoma City, OK → Memphis, TN | I-40 | ~450 | 30,000–45,000 | ~34,000 |
| Memphis, TN → Nashville, TN | I-40 | ~210 | 55,000–70,000 | ~26,000 |
| Nashville, TN → Knoxville, TN | I-40 | ~180 | 55,000–65,000 | ~22,000 |
| Knoxville, TN → Harrisburg, PA | I-81 | ~500 | 35,000–55,000 | ~45,000 |
| Harrisburg, PA → New York, NY | I-78 / NJ Tpke | ~175 | 65,000–95,000 | ~28,000 |
| Total (One-Way) | ~2,760 mi | ~50,000 avg/day | ~276,000 | |
Average Daily Impressions × Transit Days = Gross Impressions. At BillAdz's typical 40,000–60,000 daily impressions, a ~5.5 day coast-to-coast run lands right around 250,000–300,000 gross impressions one-way — and roughly double that for a round trip.
This is a modeled estimate based on typical public traffic-count data, not a live measurement. Actual circulation shifts with the exact route taken, time of year, construction detours, and whether the trailer runs day or night. For a real campaign, we track actual GPS mileage and the specific highways driven to build a route-accurate impressions report — not just a corridor average.
Tell us your lanes and we'll build a custom gross-impressions estimate for your exact trailer, dimensions, and travel pattern.